- Joined
- Sep 12, 2014
- Messages
- 18,203
- Reaction score
- 7,010
- Points
- 113
So the correlation between red counties and low Covid vaccination is coincidental?@Tibs and @Troglodyte
be smarter than where you're regurgitating your biased graphs.
Table 1. Reported Voting and Registration, by Sex and Single Years of Age: November 2020
Voting and Registration
In election years, the Current Population Survey collects data on reported voting and registration, and later reports stats by turnout, age, race and origin.www.census.gov
61.3% of registered voters reportedly voted
making this a Red/Blue issue is continuing to divide ... which is 100% what politicians do.
if 61.3% of registered voters voted, then what is the percent of people who did not vote?
38.7% of the country who did not vote.
as has been said time and time again, there is a segment of the population who hates/distrusts the government and thus do not believe their vote counts. Why you two cucked toadstools continue to push the misleading narrative that this is all a red/blue issue is beyond ridiculous. It's ... ahem ... "dangerous and irresponsible to push misinformation that does not meet community standards."
I suggest you two review the data, and then ... ahem ... circle back to this.
Provide a source that refutes this..
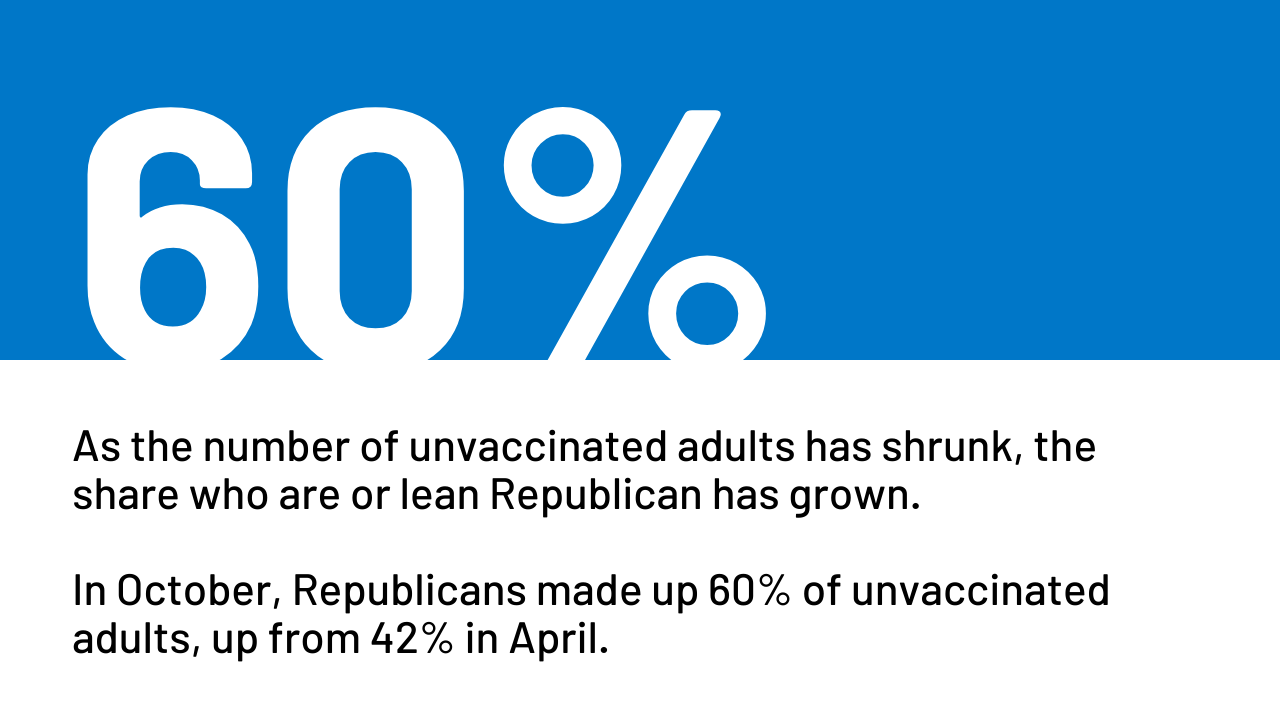
KFF COVID-19 Vaccine Monitor: The Increasing Importance of Partisanship in Predicting COVID-19 Vaccination Status
This analysis shows that as COVID-19 vaccination rates have increased over time, Republicans make up an increasingly disproportionate share of those who remain unvaccinated and that political parti…
 www.kff.org


