Ouch.
Florida: Highest Rates of Infection Occurring in Counties with Highest Vaccination Rates
In Florida, Highest Rates of Infection Occurring in Counties with Highest Vaccination Rates. Here are the Stats...

uncoverdc.com
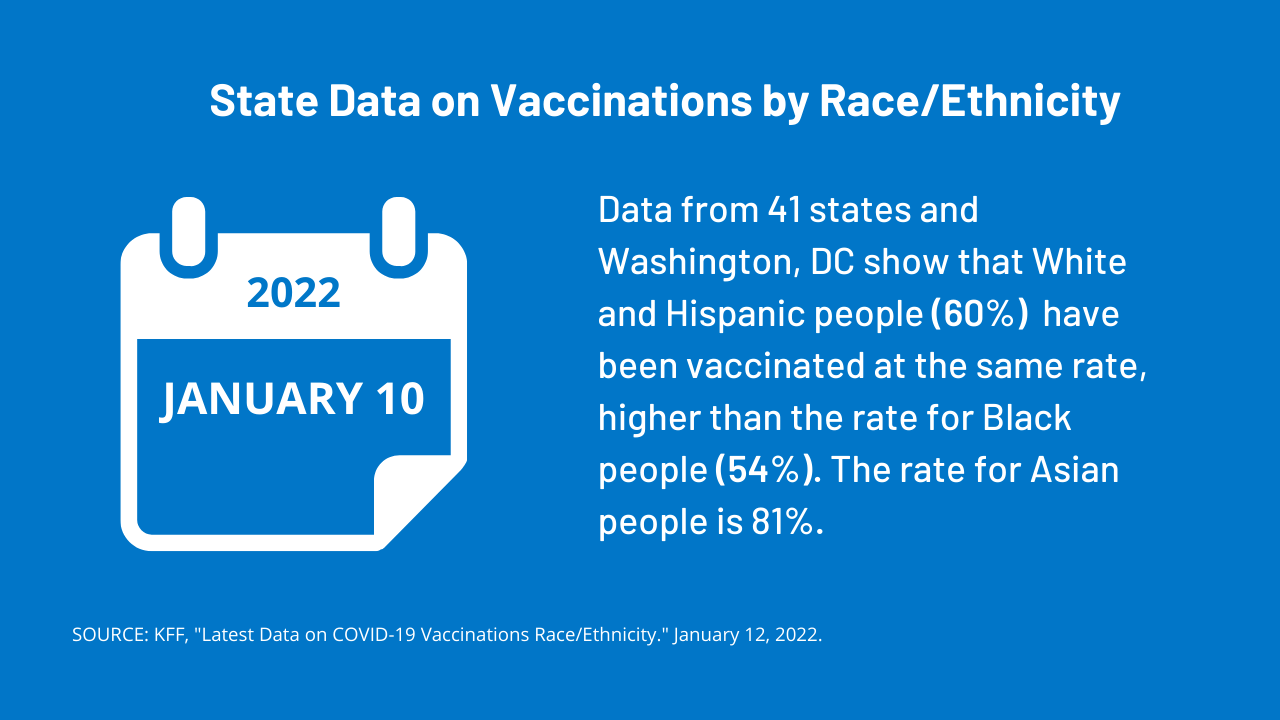
The COVID infection rate for residents of Dade County, Florida Dec. 31 – Jan. 6 was 3,796 new “cases per 100,000 population”—a rate far higher than any other county in Florida, according to the Florida Department of Public Health. This is an eye-opening statistic as 94 percent of Dade County residents age five and over have now received at least one dose of the vaccine—a vaccination rate among the highest in the country and by far the highest rate in Florida.
If
vaccines are indeed “effective” at preventing infection, one might expect residents of this county to have among the LOWEST rates of infection in the nation. Instead, the infection rate in Dade County was more than twice as high as the state average of 1,807.1 cases per 100,000 residents. In
data updated this week (See pages 5-7), Dade County continued to lead the state by a wide margin with 3,217 cases per 100,000 compared to the new state average of 1,958/100k.
Indeed, an analysis of the past two weeks’ data shows that residents who live in Florida’s least vaccinated counties typically have the lowest rates of COVID infection. Among Florida counties that reported the lowest infection rates two weeks ago, the average vaccination rate was 48.6 percent compared to the state average of all Florida counties of 72 percent.
In general,
Florida counties with the lowest vaccination rates had the lowest infection rates. The opposite was also true. The counties with the highest vaccination rates have recently experienced the highest infection rates.
While proponents of mandatory vaccines emphasize that vaccines are “
effective” at preventing “severe cases and deaths,” months after “breakthrough cases” became omnipresent, the CDC website remains replete with references stating that vaccines are effective at preventing “cases” and “infections.” For example, language at CDC sites tells us…
“ … COVID-19 vaccines are effective at
preventing most infections.”
“… The risk of infection remains much higher for
unvaccinated than vaccinated people.”
“ …
High vaccination coverage in a population reduces the spread of the virus and helps prevent new variants from emerging.”
The following analysis presents the rates of recent
COVID infection in one American state on a county-by-county basis with vaccination rates included. Readers can make their own judgments as to why the most heavily vaccinated counties are having the largest rates of outbreaks or why counties with the lowest-vaccination rates are NOT leading the state in “new cases.”
Highest Rates of Infection in Florida per County Jan. 6 – 13th
The following data shows the Florida counties that had an infection rate of 2,000 or more cases per 100,000 population in the past week.
Note: State-wide, 72 percent of Floridians age five and older have been vaccinated. The “infection rate” for the entire state this past week was 1958 cases/100k population.
County (Percent Vaccinated 5+): Cases per 100,000 population
Dade (94 percent): 3,217/100k
Broward (82 percent): 2,453/100k
Alachua (69 percent): 2,392/100k
Madison (51 percent): 2,239/100k
Osceola (80 percent): 2222/100k
Monroe (82 percent): 2,154/100k
Orange: (75 percent): 2,114/100k
Polk (65 percent): 2064/100k
Hendry (58 percent): 2060/100k
Jefferson (56 percent): 2029/100k
Highest Infection Rates by County Dec. 31 – Jan. 6
The NEGATIVE correlation between vaccination rates and “cases per 100,000” was even more striking the prior week (Dec. 31 – Jan. 6 report*).
Note: The “Cases per 100,000” average for the week of Dec. 31 – Jan. 6 was 1807/100k.
County (Percent vaccinated 5+): Cases per 100,000
Dade (93 percent): 3,797/100k
Broward (82 percent): 2,560/100k
Monroe (82 perent): 2,272/100k
Osceola (80 percent): 2014/100k
Palm Beach (74 percent): 1,963/100k
Orange: (74 percent): 1,917/100k
Counties Under 50 Percent Vaccination in Florida—Recent Infection Rates…
Florida has 14 counties where fewer than 50 percent of the county’s population (age 5+) is vaccinated. Here are those counties with their infection rates per 100,000 population this past week (Jan. 7 – Jan. 13).
No Florida county with a vaccination rate under 50 percent experienced “case rates” equal to or above the state average for the week
(1,958 cases per 100,000 population):
County (Percent vaccinated 5+): Cases per 100,000 population
Holmes (32 percent
): 1677/100k
Liberty
(37 percent): 1731/100k
Calhoun (38 percent): 973/100k
Hamilton (38 percent): 1509/100k
Suwanee (40 percent): 1357/100k
Washington (40 percent)
: 1720/100k
Dixie (41 percent): 1081/100k
Gilchrist (43 percent): 1103/100k
Lafayette (44 percent): 966/100k
Taylor (45 percent): 1586/100k
Jackson (46 percent): 1551/100k
Hardee (47 percent): 1940/100k
Columbia (47 percent): 1647/100k
Bradford (48 percent): 1353/100k
Florida Counties with Lowest Infection Rates
Of the 18 counties with the lowest infection rates in Florida last week, 14 had lower vaccination rates than the state average of 72 percent. The average infection rate (“cases per 100,000 population”) for all Florida residents was
1,958.1/100,000 of the population.
County (Percent vaccinated 5+): Infection rate per 100,000
Glades (53 percent): 790/100k
Sumter (76 percent): 913/100k
Lafayette (44 percent): 966/100k
Calhoun (38 percent): 973/100k
Lafayette
(44 percent): 966/100k
Dixie (41 percent): 1081/100k.
Charlotte (74 percent): 1101/100k
Gilchrist (43 percent): 1103/100k
Walton (58 percent): 1200/100k
Flagler (69 percent): 1259/100k
St. Johns (73 percent): 1274/100k
Nassau (63 percent): 1337/100k
Manatee (68 percent): 1337/100k
Hernando (60 percent): 1339/100k
Bradford (48 percent): 1353/100k
Suwanee (40 percent): 1357/100k
Collier (76 percent): 1369/100k
Desota (58 percent): 1384/100k


 14.4%
14.4% 24%
24%


/cloudfront-us-east-2.images.arcpublishing.com/reuters/DENLCF2SHJJSBCOXLVJLKSPD7A.jpg)