My great grandmother was Cherokee. I'm not sure what percentage that makes me. There's a lot mixed in: Italian, Greek, Dutch (yes, my grandmother) and English. Maybe more. If I was racist I'd hate myself.
You are using an out of date browser. It may not display this or other websites correctly.
You should upgrade or use an alternative browser.
You should upgrade or use an alternative browser.
Happy Juneteenth
- Thread starter Vincent
- Start date
- Joined
- Apr 22, 2014
- Messages
- 3,060
- Reaction score
- 6,498
- Points
- 113
I'll see if I can draw something up for you. Good strong wood is important though any time of the day. LMAOAny tips on Tepee building? The best I can do is morning wood.
Last edited:
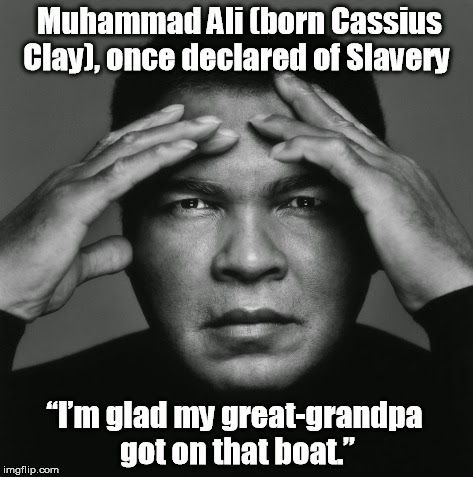
Another one of my favorite actors. The brutal truth.
I truly believe LBJ's Great Society pandered for votes at the expense of destroying the nuclear family, creating a dependent segment of our society with no hope of life improving for them. This phenomenon isn't exclusive to any one race or culture, just pointing out that far too many men don't take the responsibility of bringing life into this world seriously and the result is devastating.
Color is the furthest thing on my mind when i happen to come in contact with a black person.
Hell, I just bought a brand new completely redesigned 2026 Chevy Equinox from a black salesman at Tim Lally Chevrolet in Warrensville Heights, Oh.!
The only color I was concerned with was the color of the vehicle.
Consider discussing the Steelers of whom the majority are black.
We talk about what we like or do not like about a certain football player, not a certain black football player. Him being black or white is meaningless.
That’s the way it should be in life.
Yet today we’ve had the all knowing white liberal tell us that it’s now racist to be colorblind, that by not recognizing color we do not recognize the oppression these people are facing on a daily basis. Really??
Puhleeze…It’s fukking 2025 not 1965 for crying out loud.
- Joined
- Apr 12, 2014
- Messages
- 7,307
- Reaction score
- 7,817
- Points
- 113
We already have MLK Day to commemorate civil rights.
So what is Juneteenth?
t's a humiliation ritual for white people.
It is simply trying to make white people who never owned slaves feel guilty about things even their ancestors may not have taken part in.
It's a blunt tool being used to bludgeon white people into accepting demographic replacement and reparations.
Doesn't humiliate me because I don't give a ****.We already have MLK Day to commemorate civil rights.
So what is Juneteenth?
t's a humiliation ritual for white people.
It is simply trying to make white people who never owned slaves feel guilty about things even their ancestors may not have taken part in.
It's a blunt tool being used to bludgeon white people into accepting demographic replacement and reparations.
- Joined
- Apr 23, 2014
- Messages
- 12,251
- Reaction score
- 8,047
- Points
- 113
Racism definitely still exists, but i think it is a very small percentage. Racism also goes both ways which is something the media doesn't report on. My GF is Hispanic and her sisters who i never met or talked to, tell her that she should be with her own kind and not some white dude. Meanwhile they are in and out of jail alcoholics or have alcoholic/ abusive significant others. I live in a pretty white area, but we have probably close to 15% AA workers in the nursing home now. Some are great, some are terrible but it's the same with any color of skin. If you are a bad worker with a bad attitude and are nasty to the patients don't use the race card if you get fired. We also have patients who are racist and i feel bad for the AA workers because some are excellent.
Doesn't matter what race you are. If you're a cool decent person, no problems at all. If I can stand being in a fishing boat with you for an hour, we can be friends.
Unless you're Dutch.")
If you're a jerk, I don't want to be around you. Again it doesn't matter what race you are. I'm prejudiced against all jerks.
Unless you're Dutch.
If you're a jerk, I don't want to be around you. Again it doesn't matter what race you are. I'm prejudiced against all jerks.
- Joined
- Apr 12, 2014
- Messages
- 7,307
- Reaction score
- 7,817
- Points
- 113
Doesn't humiliate me because I don't give a ****.
The leftists are aiming for young people that are no longer taught logic, history or civics in school. They are attempting to indoctrinate your future grand kids into rolling over for being made an ethnic minority in the country their ancestors built. It's the long game, because they know they can't convince people like you or I that people that could not make the effort to not **** in the street and not throw garbage in the rivers in their country of origin are a net gain to society when they migrate to the west.
I'll never forget a DEI training session our office had to go to several years ago. I don't think DEI was called DEI at the time. It was a year or two before Covid and we'd had a turnover in leadership but most of the working stiffs there had been there for 10+ years. Myself included.Yet today we’ve had the all knowing white liberal tell us that it’s now racist to be colorblind, that by not recognizing color we do not recognize the oppression these people are facing on a daily basis.
We just thought it was a meeting to help the office learn to work better with one another. A team building session. We all went in as cordial coworkers, laughing, joking and carrying on as we normally do. All races and several different nationalities were included in that office and, we were what you'd call a diverse office though we didn't know it at the time. We were a collection of good workers who looked out for one another and generally got along.
It turned into a Caucasian shaming session. The presenters had one of my female coworkers crying as they publicly shamed her for being racist to her core because she said she was "colorblind". This lady was one of the nicest people you'd want to meet and she would help anyone out no matter their race, etc.. Color did not make any difference to her. She wound up quitting shortly afterwards and she'd been in the office for 15-20 years or so
The white males in the office? We had targets on our backs and we didn't say a word. It was the most awkward meeting I'd ever been a part of and it totally shattered our previously congenial and professional office.
I have no idea if saying you're colorblind is indeed racist but to the facilitators, it sure was.
My old office is now a shell of what it was. I left awhile ago as did most of my other long time coworkers. Everyday you'd walk on eggshells or not say anything so as to not take a chance at offending someone. Talk about a toxic environment.
We already have MLK Day to commemorate civil rights.
So what is Juneteenth?
t's a humiliation ritual for white people.
It is simply trying to make white people who never owned slaves feel guilty about things even their ancestors may not have taken part in.
It's a blunt tool being used to bludgeon white people into accepting demographic replacement and reparations.
“May” have not? Most likely have not.
There is a very small percentage of white Americans who had ancestors that were slave owners. The majority of Americans today have ancestors that arrived here as immigrants long after the end of slavery. I believe the greatest immigrant wave from mostly Eastern Europe occurred between 1890 - 1920.
Most all slaveowners were of British/English/Scottish descent. So if you ain’t either of those, chances are pretty good that your ancestors didn’t own slaves.
Last edited:
- Joined
- Apr 12, 2014
- Messages
- 7,307
- Reaction score
- 7,817
- Points
- 113
Thank you for restating my point.“May” have not? Most likely have not.
There is a very small percentage of white Americans who had ancestors that were slave owners. The majority of Americans today have ancestors that arrived here as immigrants long after the end of slavery. I believe the greatest immigrant wave from mostly Eastern Europe occurred between 1890 - 1920.
Most all slaveowners were of British/English/Scottish descent. So if you ain’t either of those, chances are pretty good that your ancestors didn’t own slaves.
- Joined
- Apr 9, 2014
- Messages
- 1,402
- Reaction score
- 1,869
- Points
- 113
Lots of mindless banter occupies the whole slavery discussion. Plenty of emotion. Not a lot of substance.
Following (in the following post) are the actual numbers from the US 1860 census. The total number of slave owning households in the US was 8%, with the highest concentration in the South. Nobody owned slaves in the North except Biden's family in Delaware, but the Obamas bought Joe as a slave so that doesn't matter.
So that 8% means that 92% of American households DID NOT own slaves. DID NOT.
This is ancient history. Nobody alive bears any responsibility, culpability, or debt whatsoever for anything related to slavery. It happened. It was narrow in scope, YET, YET, 650,000 Americans lost their lives settling the dispute, and God alone knows how many else's lives were destroyed in the process. The United States of America did the right thing and ended it at staggering cost. That should be the narrative, and that alone.
The American left, the direct descendants of the confederacy, have convinced the American negro that they are owed 'reparations' for 'crimes' that none of them can articulate, committed by people they can't identify, who, BTW, are long since dead. No American negro breathing has ever been a slave. No American negro knows anyone that was a slave. The whole slavery narrative is bull@#$%. And the dims that still own the American negro know it.
It's fascinating that the American negro occupies the same percentage of the population today as they did in 1860. Perhaps if they hadn't account for 36% of the abortions in the US, their numbers would be more substantial. Evidently unborn black lives don't matter.
- Joined
- Apr 9, 2014
- Messages
- 1,402
- Reaction score
- 1,869
- Points
- 113
| Results from the 1860 Census | |||||||
| STATE | TOTAL POPULATION | TOTAL NO. OF SLAVES | NO. OF FAMILIES | TOTAL FREE POPULATION | TOTAL NO. OF SLAVEHOLDERS | PERCENT OF FAMILIES OWNING SLAVES | SLAVES AS PERCENT OF POPULATION |
| ALABAMA | 964,201 | 435,080 | 96,603 | 529,121 | 33,730 | 35% | 45% |
| ARKANSAS | 435,450 | 111,115 | 57,244 | 324,335 | 11,481 | 20% | 26% |
| CALIFORNIA | 379,985 | 0 | 98,767 | 379,994 | 0 | 0% | 0% |
| CONNECTICUT | 460,138 | 0 | 94,831 | 460,147 | 0 | 0% | 0% |
| DELAWARE | 112,216 | 1,798 | 18,966 | 110,418 | 587 | 3% | 2% |
| FLORIDA | 140,424 | 61,745 | 15,090 | 78,679 | 5,152 | 34% | 44% |
| GEORGIA | 1,057,286 | 462,198 | 109,919 | 595,088 | 41,084 | 37% | 44% |
| ILLINOIS | 1,711,942 | 0 | 315,539 | 1,711,951 | 0 | 0% | 0% |
| INDIANA | 1,350,419 | 0 | 248,664 | 1,350,428 | 0 | 0% | 0% |
| IOWA | 674,904 | 0 | 124,098 | 674,913 | 0 | 0% | 0% |
| KANSAS | 107,206 | 2 | 21,912 | 107,204 | 2 | 0% | 0% |
| KENTUCKY | 1,155,684 | 225,483 | 166,321 | 930,201 | 38,645 | 23% | 20% |
| LOUISIANA | 708,002 | 331,726 | 74,725 | 376,276 | 22,033 | 29% | 47% |
| MAINE | 628,270 | 0 | 120,863 | 628,279 | 0 | 0% | 0% |
| MARYLAND | 687,049 | 87,189 | 110,278 | 599,860 | 13,783 | 12% | 13% |
| MASSACHUSETTS | 1,231,057 | 0 | 251,287 | 1,231,066 | 0 | 0% | 0% |
| MICHIGAN | 749,104 | 0 | 144,761 | 749,113 | 0 | 0% | 0% |
| MINNESOTA | 172,014 | 0 | 37,319 | 172,023 | 0 | 0% | 0% |
| MISSISSIPPI | 791,305 | 436,631 | 63,015 | 354,674 | 30,943 | 49% | 55% |
| MISSOURI | 1,182,012 | 114,931 | 192,073 | 1,067,081 | 24,320 | 13% | 10% |
| NEBRASKA | 28,841 | 15 | 5,931 | 28,826 | 6 | 0% | 0% |
| NEVADA | 6,848 | 0 | 2,027 | 6,857 | 0 | 0% | 0% |
| NEW HAMPSHIRE | 326,064 | 0 | 69,018 | 326,073 | 0 | 0% | 0% |
| NEW JERSEY | 672,035 | 0 | 130,348 | 672,017 | 0 | 0% | 0% |
| NEW YORK | 3,880,726 | 0 | 758,420 | 3,880,735 | 0 | 0% | 0% |
| NORTH CAROLINA | 992,622 | 331,059 | 125,090 | 661,563 | 34,658 | 28% | 33% |
| OHIO | 2,339,502 | 0 | 434,134 | 2,339,511 | 0 | 0% | 0% |
| OREGON | 52,456 | 0 | 11,063 | 52,465 | 0 | 0% | 0% |
| PENNSYLVANIA | 2,906,206 | 0 | 524,558 | 2,906,215 | 0 | 0% | 0% |
| RHODE ISLAND | 174,611 | 0 | 35,209 | 174,620 | 0 | 0% | 0% |
| SOUTH CAROLINA | 703,708 | 402,406 | 58,642 | 301,302 | 26,701 | 46% | 57% |
| TENNESSEE | 1,109,801 | 275,719 | 149,335 | 834,082 | 36,844 | 25% | 25% |
| TEXAS | 604,215 | 182,566 | 76,781 | 421,649 | 21,878 | 28% | 30% |
| VERMONT | 315,089 | 0 | 63,781 | 315,098 | 0 | 0% | 0% |
| VIRGINIA | 1,596,318 | 490,865 | 201,523 | 1,105,453 | 52,128 | 26% | 31% |
| WISCONSIN | 775,872 | 0 | 147,473 | 775,881 | 0 | 0% | 0% |
| Total | 31,183,582 | 3,950,528 | 5,155,608 | 27,233,198 | 393,975 | 8% | 13% |
You are very welcome, but what actually did was elaborate on it.Thank you for restating my point.
Last edited:
Fun facts that we weren’t taught.
Slavery was not a white mans invention.
The North African Slave trade headed up by Muslims preceded the Atlantic slave trade by some 700 yrs.
Eastern Europeans, also known as the Slavic peoples got their name as a result of being enslaved.
There were over 3000 African American slaveowners in the US.
William Ellison was one of the largest African American slaveowners having owned 68 slaves.
Some Native American tribes such as the Cherokees also owned black slaves.
The Irish were the first slaves brought to America.
There was an attempt to enslave Native Americans which failed. Too proud, would rather die.
Slavery was the way of the world. Slavery was part of African culture. Slaves were not captured by the white man.
African chieftains sold or traded captured slaves from rival tribes to the white Europeans from trading posts along the Ivory Coast.
For those wanting to ***** about an institution that dates back to ancient civilizations, Black Africans enslaving and selling their own kind, and the many Black slaveowners in the US makes blacks just as culpable as whites for the establishment of slavery in America.
Last edited: