You usually are.
"How data ARE homogenized."
"Data" is the plural of the word "datum."
Yet again, FAIL on basic language use.
Oh, and "homogenizing" temperature data does not have a substantial effect on the data?? And potentially corrupt the data? Yeah, that's rich. Data homogenizing like this, you mean?
Our analysis shows that data homogenization for the stations moved from downtowns to suburbs can lead to a significant overestimate of rising trends of surface air temperature, and this necessitates a careful evaluation and adjustment for urban biases before the data are applied in analyses of local and regional climate change.
http://link.springer.com/article/10.1007/s00704-013-0894-0
"Data homogenization" like that, you mean?
Or how about this adjustment to ground-based temperature readings in Australia?
The "normalized" data from IPCC 4 for Northern Australia:
The raw data for all 222 stations:
Finally, a graph showing the raw temperature readings compared to the "adjusted" (a.k.a., homogenized) data:
So let's review:
Polo's language use: F
Polo's critical thinking: F
Polo's credibility in discussing AGW alarmists and homogenizing data: F
Polo's use of data: F
Polo's use of the
word data: F
Seeing Polo get embarrassed yet again on her favorite topic: Priceless.
You ARE old school...lol
Andrew Garratt of the Royal Statistical Society says the debate goes back to the 1920s - and reared its head recently with some heated discussion in the Society's newsletter. "We don't have an official view," he says. "Statisticians of a certain age and status refer to them as plural but people like me use it in the singular." National Geographic magazine has debated it too.
For what it's worth, I can confidently say that this will probably be the only time I ever write the word "datum" in a Datablog post. Data as a plural term may be the proper usage but language evolves and we want to write in terms that everyone understands - and that don't seem ridiculous.
Incompetent even as a grammar Nazi.....lol......you can't write better comedy.
After you're done dancing the Charleston in the 1920's perhaps you could explain why you are still posting fraudulent graphs from Watts Up With That. I know it came from Watts as that's the only place you can find nonsense like that.
Nice job linking to a blog that twists that Chinese paper too....when will we learn anything?
Maybe now, right below......
Effect of data homogenization on estimate of temperature trend: a case of Huairou station in Beijing Municipality
The climate ostriches are having some fun with an article (Zhang et al., 2013) published spring last year in Theoretical and Applied Climatology (TAAC). According to The Hockey Schtick, the article corroborates that "leading meteorological institutions in the USA and around the world have so systematically tampered with instrumental temperature data that it cannot be safely said that there has been any significant net “global warming” in the 20th century.
And Anthony Watts writes: "From the “we told you so” department comes this paper out of China that quantifies many of the very problems with the US and global surface temperature record we have been discussing for years: the adjustments add more warming than the global warming signal itself.
Not bad!Those are huge implications for a paper about the homogenization of one station, written by a first author that can only cite one previous study written by him in Chinese and in a journal with a rather modest impact factor. I will come back to these two statements at the end.
The study
Let's have a look what the study really tells us. The nice thing is, the paper is an open access paper and the English is mostly okay (more than 95%, medium confidence), so everyone can read it.
The study investigates the influence of the urban heat island (UHI) effect on one measurement station, using two rural stations as reference. To study the influence of this gradual inhomogeneity (UHI), they need to remove the effect of the break inhomogeneities, which according to the station history are due to relocations.
They do so with a special homogenization method that hardly reacts to gradual inhomogeneities, but can still detect strong breaks. Had they used a standard homogenization method from climatology, they would also have removed the UHI effect, which they wanted to study.
In the homogenization they compare their so-called candidate station (in the city) with the average signal of two rural stations (reference). For this comparison they compute the difference of the candidate and the reference. In this difference time series, the common regional climate signal is removed. Another advantage of using a reference is that the difference time series is less noisy as the station data itself (all stations experienced about the same weather) and that you can thus see inhomogeneities better. The difference time series should be a constant value with some random noise, if you see jumps or gradual changes, this is assumed to be non-climatic (inhomogeneity) rather than climatic.
This part is standard, except that the number of time series used to compute the reference is too small. Also the reference stations will contain inhomogeneities, by averaging over many stations you can reduce the influence of these inhomogeneities. For this study the small number was likely no problem because the rural reference time series did not show clear inhomogeneities themselves.
The non-standard part is that to detect a break in the difference time series for a certain year, they apply a statistical test (a t-test) for the difference of the mean in the three years before that year and the mean of the three years after. Three years is very short, the uncertainty in the mean thus quite large and this test is consequently not very sensitive. The advantage for this method for this study is that the gradual inhomogeneity due to urbanization hardly changes in 3 years and is thus nearly undetectable. Thus their detection method can only detect strong break inhomogeneities and cannot detect gradual inhomogeneities due to urbanization.
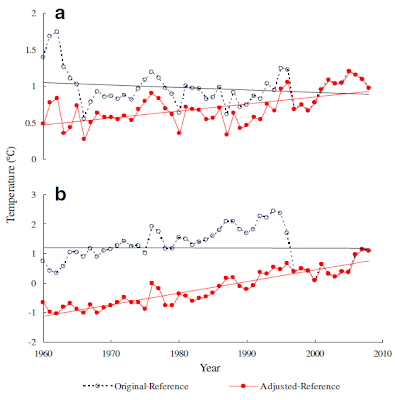
The main result is show in the figure below. It shows the difference between the city station and the rural stations, that is it shows the influence of urbanization.
The red curves of the homogenized data provide a more accurate estimate of the influence of urbanization as the black curves showing the raw data. From the raw data one would wrongly estimate that not even a rapidly growing city such as Beijing gives any artificial warming due to urbanization. Surely, the climate ostriches would prefer climatologists to use homogenization to estimate this effect more accurately?
The authors estimate that the effect of urbanization is 0.388°C per decade for the minimum temperature and 0.096°C per decade for the maximum temperature.
The differences of annual mean Tmax (a) and Tmin (b) between Huairou station and reference data for original (dotted black lines) and adjusted (solid red lines) data series during 1960–2008. The solid straight lines denote linear trends.(Figure 5 of Zhang et al., 2013)
Implications
It could be that the authors selected the right homogenization method for this specific study, but did not realize that their method is not standard and should not be used to study global warming. They namely suggest that it should be studied whether their results have implications for homogenization in general, which is not the case. As The Hockey Schtick and Anthony Watts cite from the article:
“Our analysis shows that “data homogenization for [temperature] stations moved from downtowns to suburbs can lead to a significant overestimate of rising trends of surface air temperature.”
The sentence in the article is:
"Our analysis shows that data homogenization for the stations moved from downtowns to suburbs can lead to a significant overestimate of rising trends of surface air temperature, and this necessitates a careful evaluation and adjustment for urban biases before the data are applied in analyses of local and regional climate change."
I will leave it as exercise for the reader, whether our climate ostriches should have cited the full sentence because the second part is important for its understanding. I would at least have indicated citing only the first part by ending with three dots ..., and not adding one.
I would say that the full sentence just states that you should not only homogenize the break inhomogeneities, but also the gradual inhomogeneities. That is right. James Hansen et al. already wrote so in 2001:
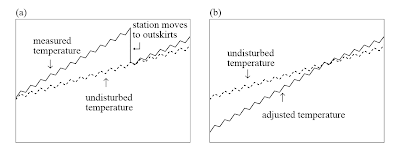
"It follows that a necessary concomitant of discontinuity adjustments is an adequate correction for urban warming. Otherwise, if the discontinuities in the temperature record have a predominance of downward jumps over upward jumps, the adjustments may introduce a false warming, as in Figure 1. This might happen, for example, if it is more common for stations to move from population centers toward the suburbs, rather than vice versa."
Part 1


