I am failing to see your point regarding density. I'll ask again, if a mask works in Cleveland, why won't it work in Athens? If a lockdown works in Cleveland, why won't it work in Athens?
Next, you're trying to correlate population density with case rates by picking outliers. That's a failed approach and you know it as well as I do. Are you familiar with the geography of Ohio? I am intimately. I've spent a ton of time in Ohio. Do you know where the population centers are? Do you understand the concept of suburbs? Do you understand that while a county may be 'locked down' people are still working and moving. Leave your bubble, drive around. Roads are packed. Do you understand the concept of travel?
I'll give you some examples. My county shut down indoor dining. So about once a week we go to a neighboring county that did not to eat out. People throughout the country travel from county to county for business, pleasure, necessity. But when they get tested, regardless where they caught it, it registers in their home county.
Let's dive into geography. Pickaway County borders Franklin, the seat of the state Government, Columbus OH. Right...next....door. It's a small county, and with Franklin right next door. Pickaway's largest town is Circleville, 34 minutes from downtown Columbus. I'm sure no one in Pickaway County, right...next...door to Franklin County ever goes into Franklin. Ever. I grew up in a small county and we would almost always leave ours to go to others for shopping and entertainment our county didn't have.
Let's take a look at every neighboring county of Franklin. Commuter counties if you will. Tell me if you see a pattern....
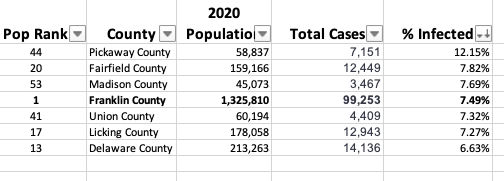
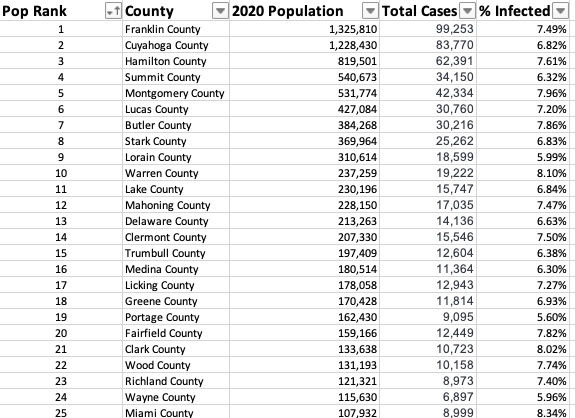
Gollee Gomer, look at that. The infection rate of the Columbus metro area shows absolutely no pattern. Franklin County sits dead in the middle geographically and from a case % rate. Some adjoining counties have higher infection rates and some lower. Hmmmm. I mean, using your logic, those suburban counties should ALL have higher infection rates because the cities are all doing it right, ammmmiiirrittte?
OK....let's look at the Cincinnati/Dayton metro area. You know they are 54 minutes apart, right? This table includes all counties that touch Montgomery and Hamilton counties, the seats of Southwest Ohio, home to 2.7Million people.
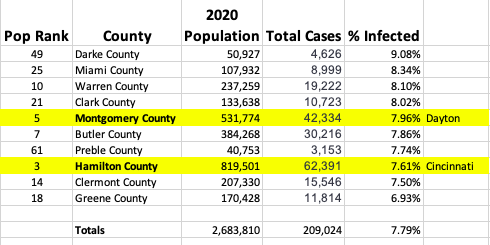
Do you see a pattern? Nope. I certainly don't. Again, no correlation. You have low population counties in this metro area with low infection rates, some with higher. No discernable pattern.
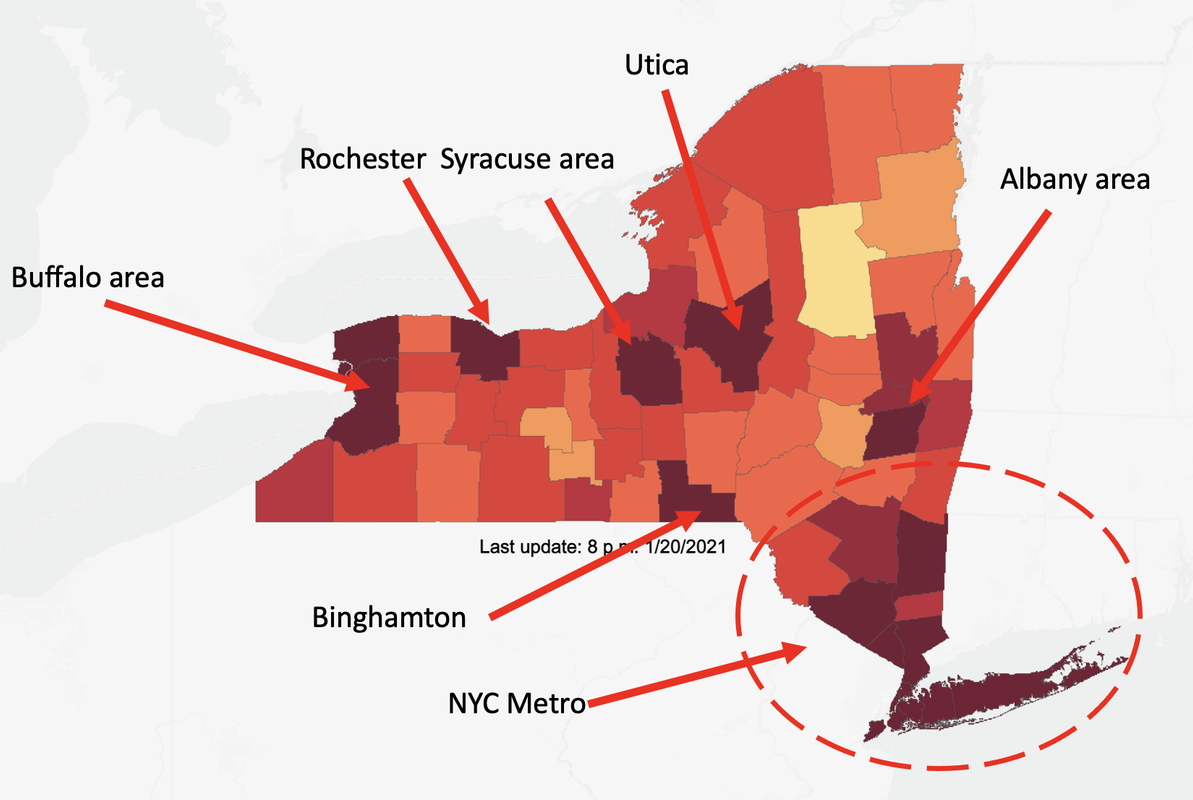
You can go throughout the state. Here, I've provided a map to guide you....
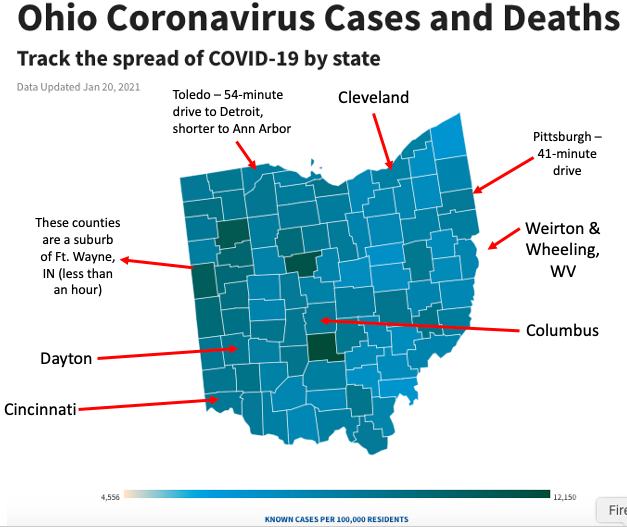
That map shows IFRs by county throughout the state. There is no pattern, save for the fact that darker green areas are "generally" in what we would call metro areas. The Columbus metro area, the Dayton/Cincy area, the Cleveland area, and those areas where people live in Ohio but commute to other states metro areas to work, eat, play.
You might try using some critical thought.
There is no analytic evidence that supports your theory that "denser" areas are doing better than less dense areas. The data doesn't agree with you. Nor does the science.
Back to banging your lockdown drum.