One, we have never said a number. Not once. Ever, in terms of a prediction. You are making said predictions for us. We have said we will not get down into the hundreds. Let's use your logic, as failed as it is as you point to ONE outlier that is NOT indicative of the rest of the country. Let's say Commiefornia could be the model and use your information:
At the 5 cases per 100K/day, California is averaging 1,824 cases per day. Multiply that by 365 days in the year. You get 665,760 cases per year.
Is that close to hundreds???? Not in the same realm as hundreds.
Even if vaccinations increase (despite the graphs below they are trailing off under Xiden) we will still be dealing with a flu-like virus for years...maybe decades...maybe forever.
Here's what else your "extrapolation" horseshit fails to account for, as the Good Dr. Makary continually reminds people - you aren't factoring in "natural immunity" that is out there. Estimates are 30-50% of people ALREADY have natural immunity to COVID. Add that to the 32% that are vaccinated. Now we are back to the "we are at or near herd immunity" point.
Regardless, let's say California gets down to 2 cases per 100K per day. That's still 288K cases a year..........SMH
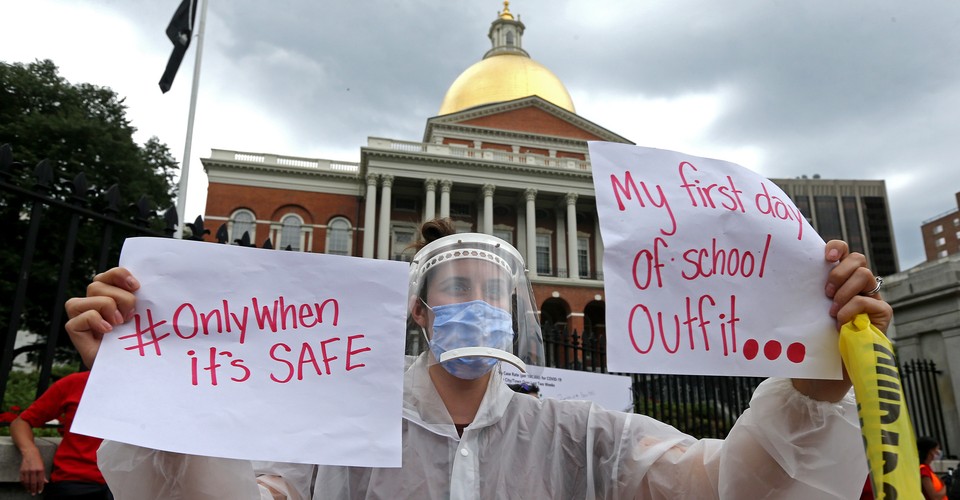
Do you bother to read anything I've written? Any evidence I've shared? Your side is pushing for masks forever. See the links on the prior pages. Your soldiers want to continue wearing them as a symbol of party affiliation.
You tell me, do you really believe they are going away?
Thanks to Trump, we are where we are. Trump's administration was the reason vaccines were fast tracked and available. His administration had the apparatus in place to deliver the vaccines. Vaccine delivery was already on a hockey-stick trajectory when Xiden assumed office. Joe needed to do literally nothing and the systems were in place for vaccine roll out. He just took the credit.
The vaccine rollout graph below shows day one of Xiden's administration. 892,410 vaccines were administered. The day prior, 911,493 had been delivered. Everything to the left of that vertical line was under Trump. You can see the trajectory had begun. Nothing was stopping it. Thank God Trump put the machinery in place to get this done.
View attachment 5125
Now I do find this interesting. One, you can see the hockey stick is consistent. Damn near a vertical linear rising line. No real increases or decreases. It by and large followed the same pattern it had prior to January 20. Again, the inertia was in place and Joe wasn't stopping or accelerating it. But notice the end of the graph? Joe can take credit for a decrease in vaccinations. On April 15, the hockey stick began trending downward....
All Hail Joe...a man riding on someone else's successes and claiming them as his own.
View attachment 5126
Of course you could enlighten us on what exactly his Administration has done that was different beyond simply adopting Trump's plan.


")