- Joined
- Apr 9, 2014
- Messages
- 18,576
- Reaction score
- 29,904
- Points
- 113
- Location
- The nearest Steelers bar.
Since the mainstream media seem to have enacted a blackout of any news regarding the United States' economic growth and improvement over the past 12 months, I figured I would endeavor to provide a convenient source for such information. I will say this - news about economic activity and economic growth was incredibly easy to find during the Obama administration, but the fact is that finding such news for 2017 is much more difficult. Google typically tosses up articles and information for the US economy ending in 2016 when I inquire about "US economic growth 2017." Be that as it may, here is what I found after spending some extra time tracking down the data:
GDP Growth
Current Numbers
3rd quarter 2017: 3.2 percent
2nd quarter 2017: 3.1 percent
Next release: January 26, 2018
Quarterly data: Real gross domestic product (GDP) increased at an annual rate of 3.2 percent in the third quarter of 2017, according to the "third" estimate released by the Bureau of Economic Analysis. In the second quarter, real GDP increased 3.1 percent.
These figures will provide GDP growth for the 4th quarter, 2017 next Friday. Those figures will also provide the yearly growth for 2017. Projections are that the 4th quarter growth will exceed 3% once again, and raise the yearly GDP growth to approximately 2.7%, the highest figure since 2006. That compares to the very sluggish 1.6% growth in 2016, Bammy's last year.
Further, that figure takes into account the sluggish growth during the first quarter of 2017 of just 1.2%, based upon a slowdown beginning from 2016. The last 3 quarters of 2017 will show a GDP growth of more than 3.2%, which would be the highest annual figure since 2005. Obama's economy never saw annual GDP growth greater than 2.6%.
Further, the GDP growth is taking place in 48 of the 50 states and encompasses a broad improvement that is much more likely to continue than regional upticks for things like energy or crops:

https://www.bea.gov/newsreleases/glance.htm
Real Disposable Income
Current Numbers
November 2017: 0.3 percent (personal income)
October 2017: 0.4 percent (personal income)
Next release: January 29, 2018
Monthly data: In November 2017, real disposable personal income increased 0.3 percent.
Once again, the income growth is spread broadly across the United States, with every single state seeing in increase in real personal income during the 3rd quarter of 2017:

https://www.bea.gov/newsreleases/regional/spi/sqpi_glance.htm
Disposable personal income has increased for three consecutive months (September-November). The December figures come out next Friday as well.
The Source for the GDP Growth
One factor that mainstream news is too lazy and stupid to analyze is the underlying source for GDP growth. Specifically, is the growth triggered by private industry - manufacturing, commerce - or by increased government spending? A GDP growth spurred by increased government spending is not sustainable. Eventually, the government runs out of other people's money. The data for the GDP growth in 2017, as compared to 2016 for example, shows that the growth is fueled by private industry, particularly manufacturing:
Quarterly Data: Finance and insurance; durable goods manufacturing; and information services were the leading contributors to the increase in U.S. economic growth in the third quarter of 2017. According to gross domestic product (GDP) by industry statistics released by the Bureau of Economic Analysis, 18 of 22 industry groups contributed to the overall 3.2 percent increase in real GDP in the third quarter.
This graph does a pretty good job at showing the preferred GDP growth in 2017 (based on private industry, manufacturing, which costs the taxpayer nothing and actually GENERATES taxes) compared to the 3rd quarter, 2016:

Unemployment Rate
The unemployment rate has fallen to 4.1%, the lowest figure since ... well, a long ******* time. Further, the annual rate is 4.4%, the lowest since 2000.
https://data.bls.gov/timeseries/LNU...ption=specific_periods&years_option=all_years
Also, "The number of persons employed part time for economic reasons (sometimes referred to as involuntary part-time workers) was essentially unchanged at 4.9 million in December but was down by 639,000 over the year. These individuals, who would have preferred full-time employment, were working part time because their hours had been cut back or because they were unable to find a full-time job."
Finally, the unemployment rate that includes workers who have simply given up looking for work - and are thereby not tabulated as part of the official unemployment rate - has fallen to 4.4% as of December, 2017. That is a decline from 5.5% in December, 2016, just one year earlier.
https://www.bls.gov/news.release/empsit.t15.htm
Also, the unemployment rates have fallen for every part of the population. "In December, 2017, the unemployment rates for adult men (3.8 percent), adult women (3.7 percent), Whites (3.7 percent), Blacks (6.8 percent), Asians (2.5 percent), and Hispanics (4.9 percent) showed little or no change."
Compare those unemployment rates with December, 2016: "Among the major worker groups, the unemployment rates for adult men (4.4 percent), adult women (4.3 percent), teenagers (14.7 percent), Whites (4.3 percent), Blacks (7.8 percent), Asians (2.6 percent), and Hispanics (5.9 percent) showed little change in December, 2016."
https://www.bls.gov/news.release/pdf/empsit.pdf
https://www.bls.gov/news.release/archives/empsit_01062017.pdf
Labor Force Participation Rates
The labor force participation rate for 2017 ranged between 62.7% and 63.1%, and averaged 62.9% for the year:

That participation rate compares very favorably to the figures for 2008-2016, where the labor force participation rate ranged from 66% in 2009 and dropped to 62.8% in 2015.
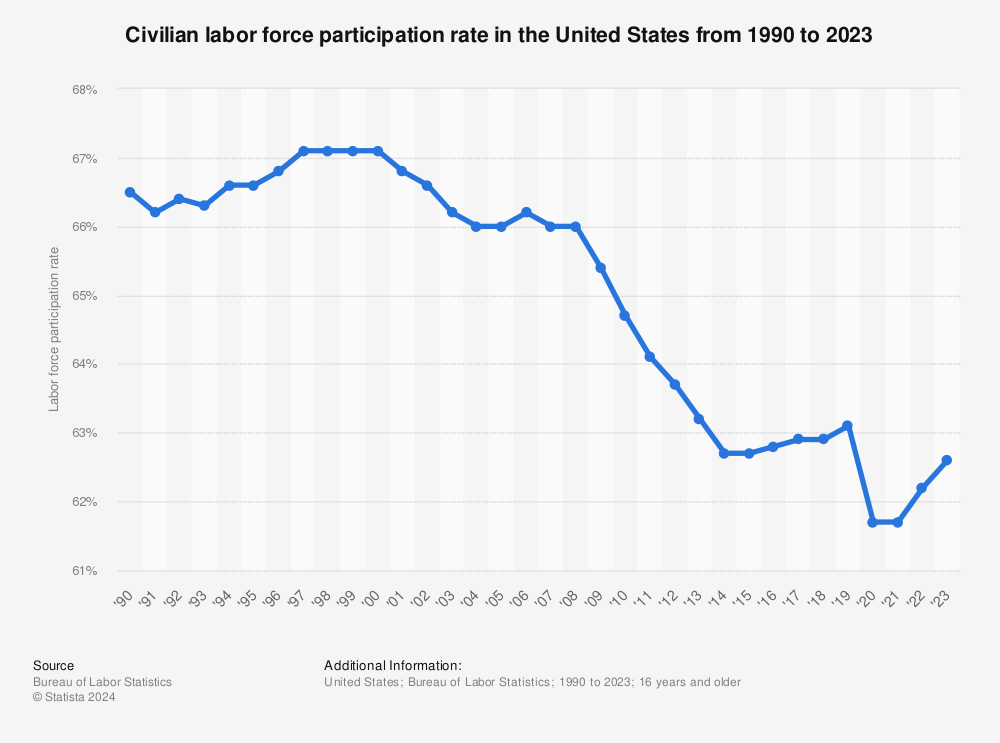
In other words, the unemployment rate is down for every working group (men, women, African-Americans, Hispanics, Asians), the level of workers who have given up looking for work is way down, where the number of people working is up.
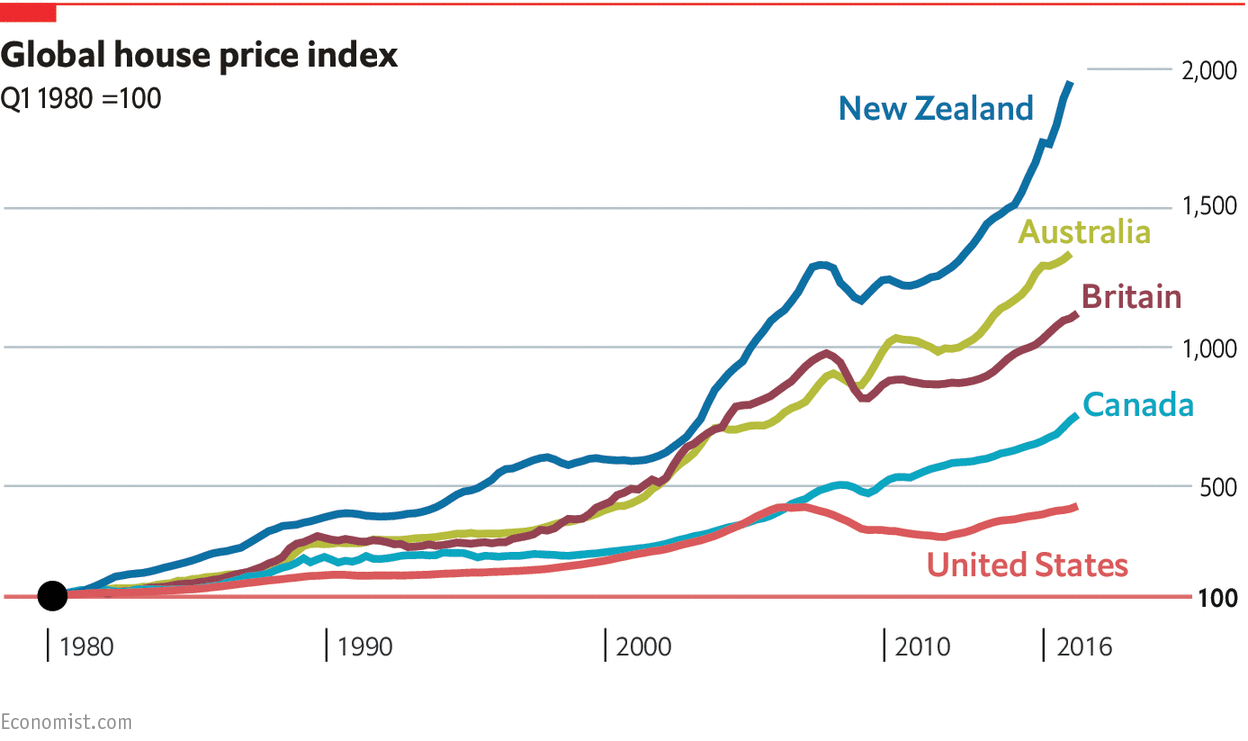
Home Ownership
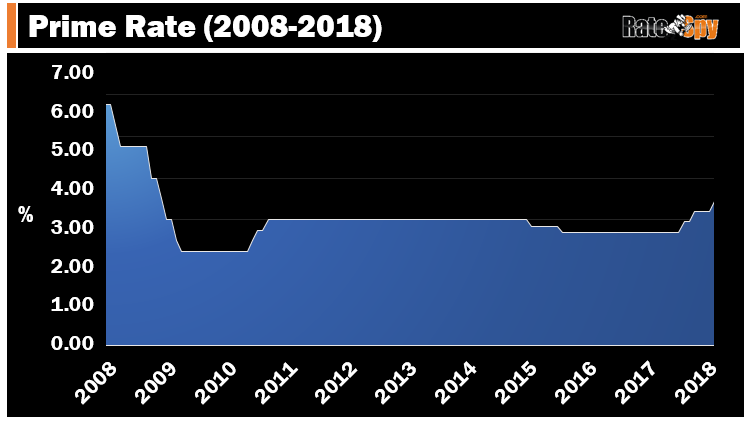
Home ownership rates in the United States has rebounded from a low of 62.9% in July, 2016 to 63.9% in July, 2017.

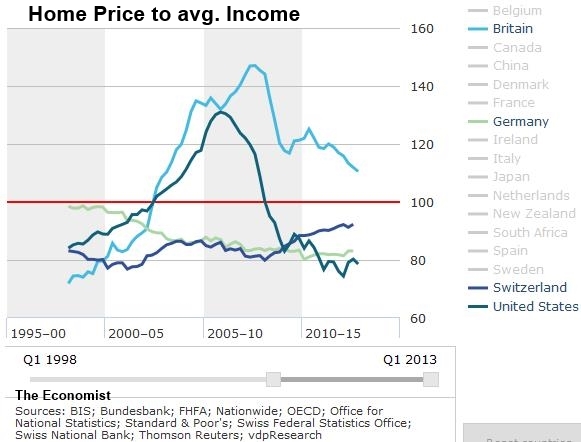
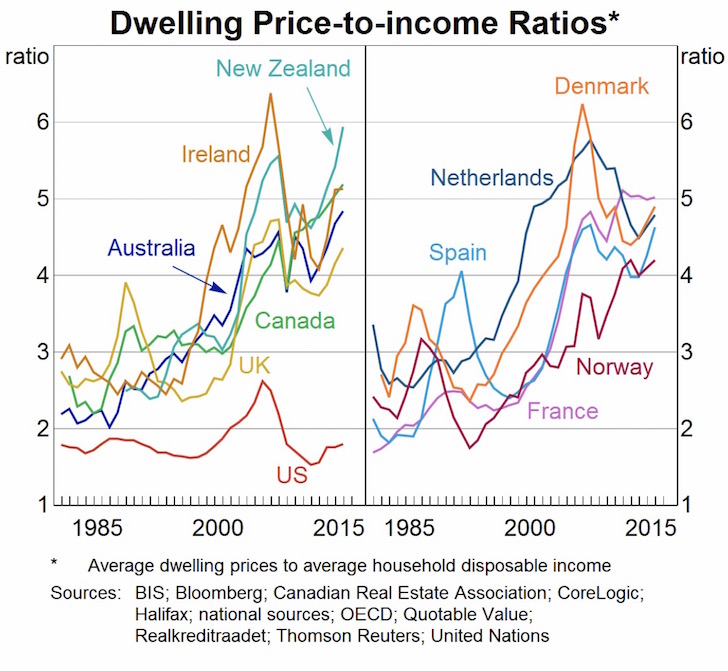
That figure is expected to reach 64.2% by the end of 2017, even where home prices are flourishing. Housing prices are one of the best indicators of the economic health of Americans, since we have more value in our homes than basically anything else. When home ownership increases, and housing prices go up, all Americans benefit.
The data are irrefutable. The economy is booming, GDP is set to increase more than 3% for the next year, income is up, housing ownership is up, labor participation is up, and unemployment is down.
Funny how this news fails to make the NYT, WaPo, LA Times, Chicago Tribune, ehh? Wonder why ...
GDP Growth
Current Numbers
3rd quarter 2017: 3.2 percent
2nd quarter 2017: 3.1 percent
Next release: January 26, 2018
Quarterly data: Real gross domestic product (GDP) increased at an annual rate of 3.2 percent in the third quarter of 2017, according to the "third" estimate released by the Bureau of Economic Analysis. In the second quarter, real GDP increased 3.1 percent.
These figures will provide GDP growth for the 4th quarter, 2017 next Friday. Those figures will also provide the yearly growth for 2017. Projections are that the 4th quarter growth will exceed 3% once again, and raise the yearly GDP growth to approximately 2.7%, the highest figure since 2006. That compares to the very sluggish 1.6% growth in 2016, Bammy's last year.
Further, that figure takes into account the sluggish growth during the first quarter of 2017 of just 1.2%, based upon a slowdown beginning from 2016. The last 3 quarters of 2017 will show a GDP growth of more than 3.2%, which would be the highest annual figure since 2005. Obama's economy never saw annual GDP growth greater than 2.6%.
Further, the GDP growth is taking place in 48 of the 50 states and encompasses a broad improvement that is much more likely to continue than regional upticks for things like energy or crops:
https://www.bea.gov/newsreleases/glance.htm
Real Disposable Income
Current Numbers
November 2017: 0.3 percent (personal income)
October 2017: 0.4 percent (personal income)
Next release: January 29, 2018
Monthly data: In November 2017, real disposable personal income increased 0.3 percent.
Once again, the income growth is spread broadly across the United States, with every single state seeing in increase in real personal income during the 3rd quarter of 2017:
https://www.bea.gov/newsreleases/regional/spi/sqpi_glance.htm
Disposable personal income has increased for three consecutive months (September-November). The December figures come out next Friday as well.
The Source for the GDP Growth
One factor that mainstream news is too lazy and stupid to analyze is the underlying source for GDP growth. Specifically, is the growth triggered by private industry - manufacturing, commerce - or by increased government spending? A GDP growth spurred by increased government spending is not sustainable. Eventually, the government runs out of other people's money. The data for the GDP growth in 2017, as compared to 2016 for example, shows that the growth is fueled by private industry, particularly manufacturing:
Quarterly Data: Finance and insurance; durable goods manufacturing; and information services were the leading contributors to the increase in U.S. economic growth in the third quarter of 2017. According to gross domestic product (GDP) by industry statistics released by the Bureau of Economic Analysis, 18 of 22 industry groups contributed to the overall 3.2 percent increase in real GDP in the third quarter.
This graph does a pretty good job at showing the preferred GDP growth in 2017 (based on private industry, manufacturing, which costs the taxpayer nothing and actually GENERATES taxes) compared to the 3rd quarter, 2016:
Unemployment Rate
The unemployment rate has fallen to 4.1%, the lowest figure since ... well, a long ******* time. Further, the annual rate is 4.4%, the lowest since 2000.
https://data.bls.gov/timeseries/LNU...ption=specific_periods&years_option=all_years
Also, "The number of persons employed part time for economic reasons (sometimes referred to as involuntary part-time workers) was essentially unchanged at 4.9 million in December but was down by 639,000 over the year. These individuals, who would have preferred full-time employment, were working part time because their hours had been cut back or because they were unable to find a full-time job."
Finally, the unemployment rate that includes workers who have simply given up looking for work - and are thereby not tabulated as part of the official unemployment rate - has fallen to 4.4% as of December, 2017. That is a decline from 5.5% in December, 2016, just one year earlier.
https://www.bls.gov/news.release/empsit.t15.htm
Also, the unemployment rates have fallen for every part of the population. "In December, 2017, the unemployment rates for adult men (3.8 percent), adult women (3.7 percent), Whites (3.7 percent), Blacks (6.8 percent), Asians (2.5 percent), and Hispanics (4.9 percent) showed little or no change."
Compare those unemployment rates with December, 2016: "Among the major worker groups, the unemployment rates for adult men (4.4 percent), adult women (4.3 percent), teenagers (14.7 percent), Whites (4.3 percent), Blacks (7.8 percent), Asians (2.6 percent), and Hispanics (5.9 percent) showed little change in December, 2016."
https://www.bls.gov/news.release/pdf/empsit.pdf
https://www.bls.gov/news.release/archives/empsit_01062017.pdf
Labor Force Participation Rates
The labor force participation rate for 2017 ranged between 62.7% and 63.1%, and averaged 62.9% for the year:
That participation rate compares very favorably to the figures for 2008-2016, where the labor force participation rate ranged from 66% in 2009 and dropped to 62.8% in 2015.
In other words, the unemployment rate is down for every working group (men, women, African-Americans, Hispanics, Asians), the level of workers who have given up looking for work is way down, where the number of people working is up.
Home Ownership
Home ownership rates in the United States has rebounded from a low of 62.9% in July, 2016 to 63.9% in July, 2017.
That figure is expected to reach 64.2% by the end of 2017, even where home prices are flourishing. Housing prices are one of the best indicators of the economic health of Americans, since we have more value in our homes than basically anything else. When home ownership increases, and housing prices go up, all Americans benefit.
The data are irrefutable. The economy is booming, GDP is set to increase more than 3% for the next year, income is up, housing ownership is up, labor participation is up, and unemployment is down.
Funny how this news fails to make the NYT, WaPo, LA Times, Chicago Tribune, ehh? Wonder why ...
Last edited: